|
500
|
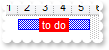
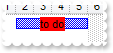
How can I change the foreground color of the HTML text or caption of the bar in the chart
local h,oGantt,var_Items

oGantt = form.EXGANTTCHARTACTIVEXCONTROL1.nativeObject
oGantt.Columns.Add("Task")
oGantt.Chart.FirstVisibleDate = "01/01/2001"
var_Items = oGantt.Items
	h = var_Items.AddItem("Task 1")
	var_Items.AddBar(h,"Task","01/02/2001","01/06/2001","K1")
	// var_Items.ItemBar(h,"K1",3) = "<bgcolor=FF0000> to do </bgcolor>"
	with (oGantt)
		TemplateDef = [dim var_Items,h]
		TemplateDef = var_Items
		TemplateDef = h
		Template = [var_Items.ItemBar(h,"K1",3) = "<bgcolor=FF0000> to do </bgcolor>"]
	endwith
	// var_Items.ItemBar(h,"K1",8) = 16777215
	with (oGantt)
		TemplateDef = [dim var_Items,h]
		TemplateDef = var_Items
		TemplateDef = h
		Template = [var_Items.ItemBar(h,"K1",8) = 16777215]
	endwith
|
|
499
|
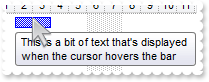
How can I assign a tooltip to a bar in the chart
local h,oGantt,var_Items

oGantt = form.EXGANTTCHARTACTIVEXCONTROL1.nativeObject
oGantt.Columns.Add("Task")
oGantt.Chart.FirstVisibleDate = "01/01/2001"
var_Items = oGantt.Items
	h = var_Items.AddItem("Task 1")
	var_Items.AddBar(h,"Task","01/02/2001","01/04/2001","K1")
	// var_Items.ItemBar(h,"K1",6) = "This is a bit of text that's displayed when the cursor hovers the bar"
	with (oGantt)
		TemplateDef = [dim var_Items,h]
		TemplateDef = var_Items
		TemplateDef = h
		Template = [var_Items.ItemBar(h,"K1",6) = "This is a bit of text that's displayed when the cursor hovers the bar"]
	endwith
|
|
498
|
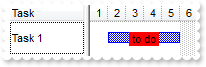
How can I vertically align the HTML text or caption of the bar in the chart
local h,oGantt,var_Items

oGantt = form.EXGANTTCHARTACTIVEXCONTROL1.nativeObject
oGantt.Columns.Add("Task")
oGantt.Chart.FirstVisibleDate = "01/01/2001"
var_Items = oGantt.Items
	h = var_Items.AddItem("Task 1")
	// var_Items.ItemHeight(h) = 32
	with (oGantt)
		TemplateDef = [dim var_Items,h]
		TemplateDef = var_Items
		TemplateDef = h
		Template = [var_Items.ItemHeight(h) = 32]
	endwith
	var_Items.AddBar(h,"Task","01/02/2001","01/06/2001","K1")
	// var_Items.ItemBar(h,"K1",3) = "<bgcolor=FF0000> to do </bgcolor>"
	with (oGantt)
		TemplateDef = [dim var_Items,h]
		TemplateDef = var_Items
		TemplateDef = h
		Template = [var_Items.ItemBar(h,"K1",3) = "<bgcolor=FF0000> to do </bgcolor>"]
	endwith
	// var_Items.ItemBar(h,"K1",5) = 0
	with (oGantt)
		TemplateDef = [dim var_Items,h]
		TemplateDef = var_Items
		TemplateDef = h
		Template = [var_Items.ItemBar(h,"K1",5) = 0]
	endwith
|
|
497
|
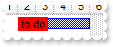
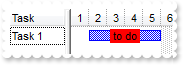
How can I align the HTML text or caption of the bar in the chart
local h,oGantt,var_Items

oGantt = form.EXGANTTCHARTACTIVEXCONTROL1.nativeObject
oGantt.Columns.Add("Task")
oGantt.Chart.FirstVisibleDate = "01/01/2001"
var_Items = oGantt.Items
	h = var_Items.AddItem("Task 1")
	var_Items.AddBar(h,"Task","01/02/2001","01/06/2001","K1")
	// var_Items.ItemBar(h,"K1",3) = "<bgcolor=FF0000> to do </bgcolor>"
	with (oGantt)
		TemplateDef = [dim var_Items,h]
		TemplateDef = var_Items
		TemplateDef = h
		Template = [var_Items.ItemBar(h,"K1",3) = "<bgcolor=FF0000> to do </bgcolor>"]
	endwith
	// var_Items.ItemBar(h,"K1",4) = 0
	with (oGantt)
		TemplateDef = [dim var_Items,h]
		TemplateDef = var_Items
		TemplateDef = h
		Template = [var_Items.ItemBar(h,"K1",4) = 0]
	endwith
|
|
496
|
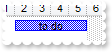
How can I assign a text or some HTML caption to a bar in the chart
local h,oGantt,var_Items

oGantt = form.EXGANTTCHARTACTIVEXCONTROL1.nativeObject
oGantt.Columns.Add("Task")
oGantt.Chart.FirstVisibleDate = "01/01/2001"
var_Items = oGantt.Items
	h = var_Items.AddItem("Task 1")
	var_Items.AddBar(h,"Task","01/02/2001","01/06/2001","K1")
	// var_Items.ItemBar(h,"K1",3) = " <bgcolor=FF0000>to do</bgcolor> "
	with (oGantt)
		TemplateDef = [dim var_Items,h]
		TemplateDef = var_Items
		TemplateDef = h
		Template = [var_Items.ItemBar(h,"K1",3) = " <bgcolor=FF0000>to do</bgcolor> "]
	endwith
|
|
495
|
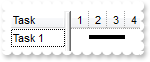
How can I change the ending date of the bar in the chart
local h,oGantt,var_Items

oGantt = form.EXGANTTCHARTACTIVEXCONTROL1.nativeObject
oGantt.Columns.Add("Task")
oGantt.Chart.FirstVisibleDate = "01/01/2001"
var_Items = oGantt.Items
	h = var_Items.AddItem("Task 1")
	var_Items.AddBar(h,"Task","01/02/2001","01/04/2001","K1")
	// var_Items.ItemBar(h,"K1",2) = "01/06/2001"
	with (oGantt)
		TemplateDef = [dim var_Items,h]
		TemplateDef = var_Items
		TemplateDef = h
		Template = [var_Items.ItemBar(h,"K1",2) = #1/6/2001#]
	endwith
|
|
494
|
How can I change the starting date of the bar in the chart
local h,oGantt,var_Items

oGantt = form.EXGANTTCHARTACTIVEXCONTROL1.nativeObject
oGantt.Columns.Add("Task")
oGantt.Chart.FirstVisibleDate = "01/01/2001"
var_Items = oGantt.Items
	h = var_Items.AddItem("Task 1")
	var_Items.AddBar(h,"Task","01/02/2001","01/04/2001","K1")
	// var_Items.ItemBar(h,"K1",1) = "01/01/2001"
	with (oGantt)
		TemplateDef = [dim var_Items,h]
		TemplateDef = var_Items
		TemplateDef = h
		Template = [var_Items.ItemBar(h,"K1",1) = #1/1/2001#]
	endwith
|
|
493
|
How can I change the style or the name of the bar in the chart
local h,oGantt,var_Items

oGantt = form.EXGANTTCHARTACTIVEXCONTROL1.nativeObject
oGantt.Columns.Add("Task")
oGantt.Chart.FirstVisibleDate = "01/01/2001"
var_Items = oGantt.Items
	h = var_Items.AddItem("Task 1")
	var_Items.AddBar(h,"Task","01/02/2001","01/04/2001","K1")
	// var_Items.ItemBar(h,"K1",0) = "Progress"
	with (oGantt)
		TemplateDef = [dim var_Items,h]
		TemplateDef = var_Items
		TemplateDef = h
		Template = [var_Items.ItemBar(h,"K1",0) = "Progress"]
	endwith
|
|
492
|
How can I access properties and methods of the bar in the chart
local h,oGantt,var_Items

oGantt = form.EXGANTTCHARTACTIVEXCONTROL1.nativeObject
oGantt.Columns.Add("Task")
oGantt.Chart.FirstVisibleDate = "01/01/2001"
var_Items = oGantt.Items
	h = var_Items.AddItem("Task 1")
	var_Items.AddBar(h,"Task","01/02/2001","01/04/2001","K1")
	// var_Items.ItemBar(h,"K1",0) = "Progress"
	with (oGantt)
		TemplateDef = [dim var_Items,h]
		TemplateDef = var_Items
		TemplateDef = h
		Template = [var_Items.ItemBar(h,"K1",0) = "Progress"]
	endwith
|
|
491
|
How can I remove all bars in the item
local h,oGantt,var_Items

oGantt = form.EXGANTTCHARTACTIVEXCONTROL1.nativeObject
oGantt.Columns.Add("Task")
oGantt.Chart.FirstVisibleDate = "01/01/2001"
var_Items = oGantt.Items
	h = var_Items.AddItem("Task 1")
	var_Items.AddBar(h,"Task","01/02/2001","01/04/2001","K1")
	var_Items.ClearBars(h)
|
|
490
|
How can I remove a bar from the chart
local h,oGantt,var_Items

oGantt = form.EXGANTTCHARTACTIVEXCONTROL1.nativeObject
oGantt.Columns.Add("Task")
oGantt.Chart.FirstVisibleDate = "01/01/2001"
var_Items = oGantt.Items
	h = var_Items.AddItem("Task 1")
	var_Items.AddBar(h,"Task","01/02/2001","01/04/2001","K1")
	var_Items.RemoveBar(h,"K1")
|
|
489
|
How can I add a bar and some text inside, in the chart area
local oGantt,var_Items

oGantt = form.EXGANTTCHARTACTIVEXCONTROL1.nativeObject
oGantt.Columns.Add("Task")
oGantt.Chart.FirstVisibleDate = "01/01/2001"
var_Items = oGantt.Items
	var_Items.AddBar(var_Items.AddItem("Task 1"),"Task","01/02/2001","01/06/2001",null," to do ")
|
|
488
|
How can I add a bar and some text inside, in the chart area
local oGantt,var_Items

oGantt = form.EXGANTTCHARTACTIVEXCONTROL1.nativeObject
oGantt.Columns.Add("Task")
oGantt.Chart.FirstVisibleDate = "01/01/2001"
var_Items = oGantt.Items
	var_Items.AddBar(var_Items.AddItem("Task 1"),"Task","01/02/2001","01/06/2001",null,"<bgcolor=FF0000> to do </bgcolor>")
|
|
487
|
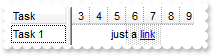
How can I add an anchor or a hyperline in the chart area
local oGantt,var_Items

oGantt = form.EXGANTTCHARTACTIVEXCONTROL1.nativeObject
oGantt.Columns.Add("Task")
oGantt.Chart.FirstVisibleDate = "01/01/2001"
var_Items = oGantt.Items
	var_Items.AddBar(var_Items.AddItem("Task 1"),"","01/02/2001","01/14/2001",null,"just a <a1>link</a>")
|
|
486
|
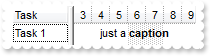
How can I add some text or captions in the chart area
local oGantt,var_Items

oGantt = form.EXGANTTCHARTACTIVEXCONTROL1.nativeObject
oGantt.Columns.Add("Task")
oGantt.Chart.FirstVisibleDate = "01/01/2001"
var_Items = oGantt.Items
	var_Items.AddBar(var_Items.AddItem("Task 1"),"","01/02/2001","01/14/2001",null,"just a <b>caption</b>")
|
|
485
|
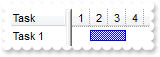
How can I add a bar in the chart area
local oGantt,var_Items

oGantt = form.EXGANTTCHARTACTIVEXCONTROL1.nativeObject
oGantt.Columns.Add("Task")
oGantt.Chart.FirstVisibleDate = "01/01/2001"
var_Items = oGantt.Items
	var_Items.AddBar(var_Items.AddItem("Task 1"),"Task","01/02/2001","01/04/2001")
|
|
484
|
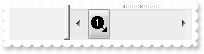
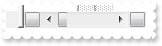
Is there any option to put a picture or an icon to the thumb part of the scroll bar
local oGantt

oGantt = form.EXGANTTCHARTACTIVEXCONTROL1.nativeObject
oGantt.Images("gBJJgBAIDAAGAAEAAQhYAf8Pf4hh0QihCJo2AEZjQAjEZFEaIEaEEaAIAkcbk0olUrlktl0vmExmUzmk1m03nE5nU7nk9n0/oFBoVDolFo1HpFJpVLplNp1PqFRqVTqlVq1XrFZrVbrldr1fsFhsVjslls1ntFptVrtltt1vuFxuVzul1u13vF5vV7vl9v1/wGBwWDwmFw2HxGJxWLxmNx0xiFdyOTh8Tf9ZymXx+QytcyNgz8r0OblWjyWds+m0ka1Vf1ta1+r1mos2xrG2xeZ0+a0W0qOx3GO4NV3WeyvD2XJ5XL5nN51aiw+lfSj0gkUkAEllHanHI5j/cHg8EZf7w8vl8j4f/qfEZeB09/vjLAB30+kZQAP/P5/H6/yNAOAEAwCjMBwFAEDwJBMDwLBYAP2/8Hv8/gAGAD8LQs9w/nhDY/oygIA=")
oGantt.Template = [ScrollPartCaption(2,256) = "<img>1</img>"] // oGantt.ScrollPartCaption(2,256) = "<img>1</img>"
oGantt.Template = [ScrollThumbSize(2) = 24] // oGantt.ScrollThumbSize(2) = 24
|
|
483
|
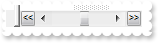
How can I scroll fast the chart, or page by page

local oGantt

oGantt = form.EXGANTTCHARTACTIVEXCONTROL1.nativeObject
oGantt.Images("gBJJgBAIDAAGAAEAAQhYAf8Pf4hh0QihCJo2AEZjQAjEZFEaIEaEEaAIAkcbk0olUrlktl0vmExmUzmk1m03nE5nU7nk9n0/oFBoVDolFo1HpFJpVLplNp1PqFRqVTqlVq1XrFZrVbrldr1fsFhsVjslls1ntFptVrtltt1vuFxuVzul1u13vF5vV7vl9v1/wGBwWDwmFw2HxGJxWLxmNx0xiFdyOTh8Tf9ZymXx+QytcyNgz8r0OblWjyWds+m0ka1Vf1ta1+r1mos2xrG2xeZ0+a0W0qOx3GO4NV3WeyvD2XJ5XL5nN51aiw+lfSj0gkUkAEllHanHI5j/cHg8EZf7w8vl8j4f/qfEZeB09/vjLAB30+kZQAP/P5/H6/yNAOAEAwCjMBwFAEDwJBMDwLBYAP2/8Hv8/gAGAD8LQs9w/nhDY/oygIA=")
oGantt.ScrollHeight = 20
oGantt.ScrollButtonWidth = 20
oGantt.AllowChartScrollPage = true
oGantt.Template = [ScrollPartCaption(2,2048) = "<img>1</img>"] // oGantt.ScrollPartCaption(2,2048) = "<img>1</img>"
oGantt.Template = [ScrollPartCaption(2,32) = "<img>2</img>"] // oGantt.ScrollPartCaption(2,32) = "<img>2</img>"
|
|
482
|
How can I scroll fast the chart, or page by page
local oGantt

oGantt = form.EXGANTTCHARTACTIVEXCONTROL1.nativeObject
oGantt.ScrollButtonWidth = 16
oGantt.AllowChartScrollPage = true
oGantt.Template = [ScrollPartCaption(2,2048) = "<<"] // oGantt.ScrollPartCaption(2,2048) = "<<"
oGantt.Template = [ScrollPartCaption(2,32) = ">>"] // oGantt.ScrollPartCaption(2,32) = ">>"
|
|
481
|
How can I scroll fast the chart, or page by page
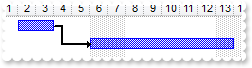
local oGantt

oGantt = form.EXGANTTCHARTACTIVEXCONTROL1.nativeObject
oGantt.AllowChartScrollPage = true
|
|
480
|
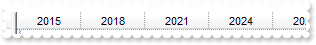
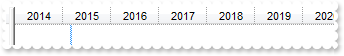
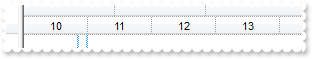
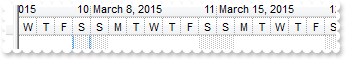
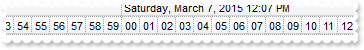
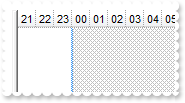
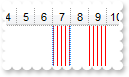
How can I display years, from 3 to 3
local oGantt,var_Level

oGantt = form.EXGANTTCHARTACTIVEXCONTROL1.nativeObject
oGantt.Chart.UnitWidth = 64
var_Level = oGantt.Chart.Level(0)
	var_Level.Label = "<%yyyy%>"
	var_Level.Unit = 0
	var_Level.Count = 3
|
|
479
|
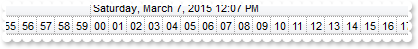
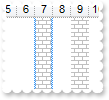
How can I display years
local oGantt,var_Level

oGantt = form.EXGANTTCHARTACTIVEXCONTROL1.nativeObject
oGantt.Chart.UnitWidth = 64
var_Level = oGantt.Chart.Level(0)
	var_Level.Label = "<%yy%>"
	var_Level.Unit = 0
|
|
478
|
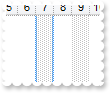
How can I display years
local oGantt,var_Level

oGantt = form.EXGANTTCHARTACTIVEXCONTROL1.nativeObject
oGantt.Chart.UnitWidth = 48
// oGantt.Chart.Level(0).Label = 0
var_Level = oGantt.Chart.Level(0)
with (oGantt)
	TemplateDef = [dim var_Level]
	TemplateDef = var_Level
	Template = [var_Level.Label = 0]
endwith
|
|
477
|
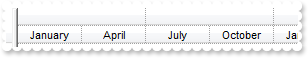
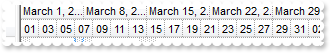
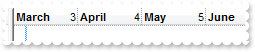
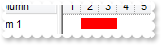
How can I display months, from 3 to 3
local oGantt,var_Level,var_Level1

oGantt = form.EXGANTTCHARTACTIVEXCONTROL1.nativeObject
oGantt.Chart.FirstVisibleDate = "01/01/2001"
oGantt.Chart.LevelCount = 2
oGantt.Chart.UnitWidth = 64
// oGantt.Chart.Level(0).Label = 1
var_Level = oGantt.Chart.Level(0)
with (oGantt)
	TemplateDef = [dim var_Level]
	TemplateDef = var_Level
	Template = [var_Level.Label = 1]
endwith
var_Level1 = oGantt.Chart.Level(1)
	var_Level1.Label = "<%mmmm%>"
	var_Level1.Unit = 16
	var_Level1.Count = 3
|
|
476
|
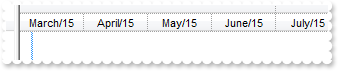
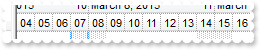
How can I display months
local oGantt,var_Level,var_Level1

oGantt = form.EXGANTTCHARTACTIVEXCONTROL1.nativeObject
oGantt.Chart.UnitWidth = 64
oGantt.Chart.LevelCount = 2
// oGantt.Chart.Level(0).Label = 1
var_Level = oGantt.Chart.Level(0)
with (oGantt)
	TemplateDef = [dim var_Level]
	TemplateDef = var_Level
	Template = [var_Level.Label = 1]
endwith
var_Level1 = oGantt.Chart.Level(1)
	var_Level1.Label = "<%mmmm%>/<%yy%>"
	var_Level1.Unit = 16
|
|
475
|
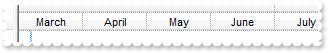
How can I display months
local oGantt,var_Level,var_Level1

oGantt = form.EXGANTTCHARTACTIVEXCONTROL1.nativeObject
oGantt.Chart.LevelCount = 2
oGantt.Chart.UnitWidth = 64
// oGantt.Chart.Level(0).Label = 1
var_Level = oGantt.Chart.Level(0)
with (oGantt)
	TemplateDef = [dim var_Level]
	TemplateDef = var_Level
	Template = [var_Level.Label = 1]
endwith
// oGantt.Chart.Level(1).Label = 16
var_Level1 = oGantt.Chart.Level(1)
with (oGantt)
	TemplateDef = [dim var_Level1]
	TemplateDef = var_Level1
	Template = [var_Level1.Label = 16]
endwith
|
|
474
|
How can I display weeks
local oGantt,var_Level,var_Level1

oGantt = form.EXGANTTCHARTACTIVEXCONTROL1.nativeObject
oGantt.Chart.LevelCount = 2
oGantt.Chart.UnitWidth = 64
// oGantt.Chart.Level(0).Label = 17
var_Level = oGantt.Chart.Level(0)
with (oGantt)
	TemplateDef = [dim var_Level]
	TemplateDef = var_Level
	Template = [var_Level.Label = 17]
endwith
// oGantt.Chart.Level(1).Label = 256
var_Level1 = oGantt.Chart.Level(1)
with (oGantt)
	TemplateDef = [dim var_Level1]
	TemplateDef = var_Level1
	Template = [var_Level1.Label = 256]
endwith
|
|
473
|
How can I display weeks
local oGantt,var_Level,var_Level1

oGantt = form.EXGANTTCHARTACTIVEXCONTROL1.nativeObject
oGantt.Chart.LevelCount = 2
// oGantt.Chart.Level(0).Label = 17
var_Level = oGantt.Chart.Level(0)
with (oGantt)
	TemplateDef = [dim var_Level]
	TemplateDef = var_Level
	Template = [var_Level.Label = 17]
endwith
// oGantt.Chart.Level(1).Label = "<%ww%>"
var_Level1 = oGantt.Chart.Level(1)
with (oGantt)
	TemplateDef = [dim var_Level1]
	TemplateDef = var_Level1
	Template = [var_Level1.Label = "<%ww%>"]
endwith
|
|
472
|
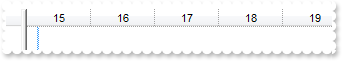
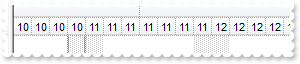
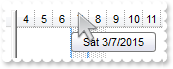
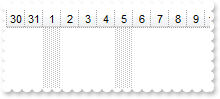
How can I display days, from 2 to 2
local oGantt,var_Level,var_Level1

oGantt = form.EXGANTTCHARTACTIVEXCONTROL1.nativeObject
oGantt.Chart.LevelCount = 2
// oGantt.Chart.Level(0).Label = 256
var_Level = oGantt.Chart.Level(0)
with (oGantt)
	TemplateDef = [dim var_Level]
	TemplateDef = var_Level
	Template = [var_Level.Label = 256]
endwith
var_Level1 = oGantt.Chart.Level(1)
	var_Level1.Label = "<%dd%>"
	var_Level1.Count = 2
|
|
471
|
How can I display days
local oGantt,var_Level,var_Level1

oGantt = form.EXGANTTCHARTACTIVEXCONTROL1.nativeObject
oGantt.Chart.LevelCount = 2
// oGantt.Chart.Level(0).Label = 256
var_Level = oGantt.Chart.Level(0)
with (oGantt)
	TemplateDef = [dim var_Level]
	TemplateDef = var_Level
	Template = [var_Level.Label = 256]
endwith
// oGantt.Chart.Level(1).Label = "<%dd%>"
var_Level1 = oGantt.Chart.Level(1)
with (oGantt)
	TemplateDef = [dim var_Level1]
	TemplateDef = var_Level1
	Template = [var_Level1.Label = "<%dd%>"]
endwith
|
|
470
|
How can I display days
local oGantt,var_Level,var_Level1

oGantt = form.EXGANTTCHARTACTIVEXCONTROL1.nativeObject
oGantt.Chart.LevelCount = 2
// oGantt.Chart.Level(0).Label = 256
var_Level = oGantt.Chart.Level(0)
with (oGantt)
	TemplateDef = [dim var_Level]
	TemplateDef = var_Level
	Template = [var_Level.Label = 256]
endwith
// oGantt.Chart.Level(1).Label = 4096
var_Level1 = oGantt.Chart.Level(1)
with (oGantt)
	TemplateDef = [dim var_Level1]
	TemplateDef = var_Level1
	Template = [var_Level1.Label = 4096]
endwith
|
|
469
|
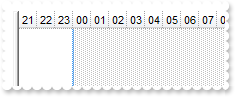
How can I display hours, from 6 to 6
local oGantt,var_Level,var_Level1

oGantt = form.EXGANTTCHARTACTIVEXCONTROL1.nativeObject
oGantt.Chart.FirstVisibleDate = "00:00"
oGantt.Chart.LevelCount = 2
// oGantt.Chart.Level(0).Label = 4096
var_Level = oGantt.Chart.Level(0)
with (oGantt)
	TemplateDef = [dim var_Level]
	TemplateDef = var_Level
	Template = [var_Level.Label = 4096]
endwith
var_Level1 = oGantt.Chart.Level(1)
	var_Level1.Label = "<%hh%>"
	var_Level1.Count = 6
|
|
468
|
How can I display hours
local oGantt,var_Level,var_Level1

oGantt = form.EXGANTTCHARTACTIVEXCONTROL1.nativeObject
oGantt.Chart.LevelCount = 2
// oGantt.Chart.Level(0).Label = 4096
var_Level = oGantt.Chart.Level(0)
with (oGantt)
	TemplateDef = [dim var_Level]
	TemplateDef = var_Level
	Template = [var_Level.Label = 4096]
endwith
// oGantt.Chart.Level(1).Label = "<%hh%>"
var_Level1 = oGantt.Chart.Level(1)
with (oGantt)
	TemplateDef = [dim var_Level1]
	TemplateDef = var_Level1
	Template = [var_Level1.Label = "<%hh%>"]
endwith
|
|
467
|
How can I display hours
local oGantt,var_Level,var_Level1

oGantt = form.EXGANTTCHARTACTIVEXCONTROL1.nativeObject
oGantt.Chart.LevelCount = 2
// oGantt.Chart.Level(0).Label = 4096
var_Level = oGantt.Chart.Level(0)
with (oGantt)
	TemplateDef = [dim var_Level]
	TemplateDef = var_Level
	Template = [var_Level.Label = 4096]
endwith
// oGantt.Chart.Level(1).Label = 65536
var_Level1 = oGantt.Chart.Level(1)
with (oGantt)
	TemplateDef = [dim var_Level1]
	TemplateDef = var_Level1
	Template = [var_Level1.Label = 65536]
endwith
|
|
466
|
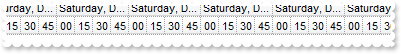
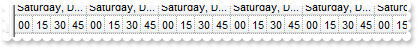
How can I display minutes, from 15 to 15
local oGantt,var_Level,var_Level1

oGantt = form.EXGANTTCHARTACTIVEXCONTROL1.nativeObject
oGantt.Chart.FirstVisibleDate = "00:00"
oGantt.Chart.LevelCount = 2
// oGantt.Chart.Level(0).Label = 65536
var_Level = oGantt.Chart.Level(0)
with (oGantt)
	TemplateDef = [dim var_Level]
	TemplateDef = var_Level
	Template = [var_Level.Label = 65536]
endwith
var_Level1 = oGantt.Chart.Level(1)
	var_Level1.Label = "<%nn%>"
	var_Level1.Count = 15
|
|
465
|
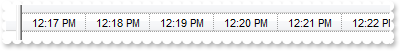
How can I display minutes
local oGantt,var_Level,var_Level1

oGantt = form.EXGANTTCHARTACTIVEXCONTROL1.nativeObject
oGantt.Chart.LevelCount = 2
// oGantt.Chart.Level(0).Label = 65536
var_Level = oGantt.Chart.Level(0)
with (oGantt)
	TemplateDef = [dim var_Level]
	TemplateDef = var_Level
	Template = [var_Level.Label = 65536]
endwith
// oGantt.Chart.Level(1).Label = "<%nn%>"
var_Level1 = oGantt.Chart.Level(1)
with (oGantt)
	TemplateDef = [dim var_Level1]
	TemplateDef = var_Level1
	Template = [var_Level1.Label = "<%nn%>"]
endwith
|
|
464
|
How can I display minutes
local oGantt,var_Level,var_Level1

oGantt = form.EXGANTTCHARTACTIVEXCONTROL1.nativeObject
oGantt.Chart.LevelCount = 2
oGantt.Chart.UnitWidth = 64
// oGantt.Chart.Level(0).Label = 65536
var_Level = oGantt.Chart.Level(0)
with (oGantt)
	TemplateDef = [dim var_Level]
	TemplateDef = var_Level
	Template = [var_Level.Label = 65536]
endwith
// oGantt.Chart.Level(1).Label = 1048576
var_Level1 = oGantt.Chart.Level(1)
with (oGantt)
	TemplateDef = [dim var_Level1]
	TemplateDef = var_Level1
	Template = [var_Level1.Label = 1048576]
endwith
|
|
463
|
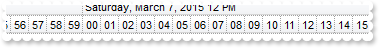
How can I display seconds, from 15 to 15
local oGantt,var_Level,var_Level1

oGantt = form.EXGANTTCHARTACTIVEXCONTROL1.nativeObject
oGantt.Chart.FirstVisibleDate = "00:00"
oGantt.Chart.LevelCount = 2
// oGantt.Chart.Level(0).Label = 1048576
var_Level = oGantt.Chart.Level(0)
with (oGantt)
	TemplateDef = [dim var_Level]
	TemplateDef = var_Level
	Template = [var_Level.Label = 1048576]
endwith
var_Level1 = oGantt.Chart.Level(1)
	var_Level1.Label = "<%ss%>"
	var_Level1.Count = 15
|
|
462
|
How can I display seconds
local oGantt,var_Level,var_Level1

oGantt = form.EXGANTTCHARTACTIVEXCONTROL1.nativeObject
oGantt.Chart.LevelCount = 2
// oGantt.Chart.Level(0).Label = 1048576
var_Level = oGantt.Chart.Level(0)
with (oGantt)
	TemplateDef = [dim var_Level]
	TemplateDef = var_Level
	Template = [var_Level.Label = 1048576]
endwith
// oGantt.Chart.Level(1).Label = "<%ss%>"
var_Level1 = oGantt.Chart.Level(1)
with (oGantt)
	TemplateDef = [dim var_Level1]
	TemplateDef = var_Level1
	Template = [var_Level1.Label = "<%ss%>"]
endwith
|
|
461
|
How can I display seconds
local oGantt,var_Level,var_Level1

oGantt = form.EXGANTTCHARTACTIVEXCONTROL1.nativeObject
oGantt.Chart.LevelCount = 2
// oGantt.Chart.Level(0).Label = 1048576
var_Level = oGantt.Chart.Level(0)
with (oGantt)
	TemplateDef = [dim var_Level]
	TemplateDef = var_Level
	Template = [var_Level.Label = 1048576]
endwith
// oGantt.Chart.Level(1).Label = 16777216
var_Level1 = oGantt.Chart.Level(1)
with (oGantt)
	TemplateDef = [dim var_Level1]
	TemplateDef = var_Level1
	Template = [var_Level1.Label = 16777216]
endwith
|
|
460
|
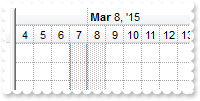
How can I align the text being shown in the chart's header
local oGantt,var_Level

oGantt = form.EXGANTTCHARTACTIVEXCONTROL1.nativeObject
oGantt.Chart.UnitWidth = 64
var_Level = oGantt.Chart.Level(0)
	var_Level.Label = "<b><%mmmm%></b> <r><%m%>"
	var_Level.Unit = 16
	var_Level.Alignment = 0
|
|
459
|
How can I hide the tooltip being displayed in the chart's header
local oGantt,var_Level

oGantt = form.EXGANTTCHARTACTIVEXCONTROL1.nativeObject
// oGantt.Chart.Level(0).ToolTip = ""
var_Level = oGantt.Chart.Level(0)
with (oGantt)
	TemplateDef = [dim var_Level]
	TemplateDef = var_Level
	Template = [var_Level.ToolTip = ""]
endwith
|
|
458
|
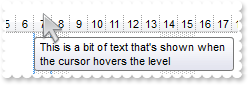
How can I change the tooltip being displayed in the chart's header
local oGantt,var_Level

oGantt = form.EXGANTTCHARTACTIVEXCONTROL1.nativeObject
// oGantt.Chart.Level(0).ToolTip = "This is a bit of text that's shown when the cursor hovers the level"
var_Level = oGantt.Chart.Level(0)
with (oGantt)
	TemplateDef = [dim var_Level]
	TemplateDef = var_Level
	Template = [var_Level.ToolTip = "This is a bit of text that's shown when the cursor hovers the level"]
endwith
|
|
457
|
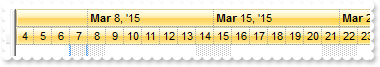
How can I change the visual appearance of the chart's header, where levels are displayed, using your EBN files
local oGantt

oGantt = form.EXGANTTCHARTACTIVEXCONTROL1.nativeObject
oGantt.VisualAppearance.Add(1,"c:\exontrol\images\normal.ebn")
oGantt.Chart.LevelCount = 2
oGantt.Chart.BackColorLevelHeader = 0x1000000
|
|
456
|
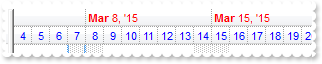
How can I change the level's foreground color in the chart
local oGantt,var_Level,var_Level1

oGantt = form.EXGANTTCHARTACTIVEXCONTROL1.nativeObject
oGantt.Chart.LevelCount = 2
// oGantt.Chart.Level(0).ForeColor = 0xff
var_Level = oGantt.Chart.Level(0)
with (oGantt)
	TemplateDef = [dim var_Level]
	TemplateDef = var_Level
	Template = [var_Level.ForeColor = 255]
endwith
// oGantt.Chart.Level(1).ForeColor = 0xff0000
var_Level1 = oGantt.Chart.Level(1)
with (oGantt)
	TemplateDef = [dim var_Level1]
	TemplateDef = var_Level1
	Template = [var_Level1.ForeColor = 16711680]
endwith
|
|
455
|
How can I change the level's background color in the chart
local oGantt,var_Level

oGantt = form.EXGANTTCHARTACTIVEXCONTROL1.nativeObject
oGantt.Chart.LevelCount = 2
// oGantt.Chart.Level(0).BackColor = 0xff
var_Level = oGantt.Chart.Level(0)
with (oGantt)
	TemplateDef = [dim var_Level]
	TemplateDef = var_Level
	Template = [var_Level.BackColor = 255]
endwith
|
|
454
|
How can I save data on XML format
local oGantt

oGantt = form.EXGANTTCHARTACTIVEXCONTROL1.nativeObject
|
|
453
|
How can I load data on XML format
local oGantt

oGantt = form.EXGANTTCHARTACTIVEXCONTROL1.nativeObject
|
|
452
|
How can I add icons or pictures to the scale or zoom area
local oGantt,var_Chart,var_Items
oGantt = form.EXGANTTCHARTACTIVEXCONTROL1.nativeObject
oGantt.Template = [HTMLPicture("pic1") = "c:\exontrol\images\zipdisk.gif"] // oGantt.HTMLPicture("pic1") = "c:\exontrol\images\zipdisk.gif"
oGantt.Images("gBJJgBAIDAAGAAEAAQhYAf8Pf4hh0QihCJo2AEZjQAjEZFEaIEaEEaAIAkcbk0olUrlktl0vmExmUzmk1m03nE5nU7nk9n0/oFBoVDolFo1HpFJpVLplNp1PqFRqVTqlVq1XrFZrVbrldr1fsFhsVjslls1ntFptVrtltt1vuFxuVzul1u13vF5vV7vl9v1/wGBwWDwmFw2HxGJxWLxmNx0xiFdyOTh8Tf9ZymXx+QytcyNgz8r0OblWjyWds+m0ka1Vf1ta1+r1mos2xrG2xeZ0+a0W0qOx3GO4NV3WeyvD2XJ5XL5nN51aiw+lfSj0gkUkAEllHanHI5j/cHg8EZf7w8vl8j4f/qfEZeB09/vjLAB30+kZQAP/P5/H6/yNAOAEAwCjMBwFAEDwJBMDwLBYAP2/8Hv8/gAGAD8LQs9w/nhDY/oygIA=")
var_Chart = oGantt.Chart
var_Chart.OverviewHeight = 48
var_Chart.OverviewVisible = true
var_Chart.AllowOverviewZoom = -1
var_Chart.OverviewZoomCaption = "Year|�Year|�Year|<img>3</img> Week|Third|<img>2</img> Day|<img>pic1</img>|Hour|Min|Sec"
// var_Chart.Label(0) = ""
with (oGantt)
TemplateDef = [dim var_Chart]
TemplateDef = var_Chart
Template = [var_Chart.Label(0) = ""]
endwith
// var_Chart.Label(1) = ""
with (oGantt)
TemplateDef = [dim var_Chart]
TemplateDef = var_Chart
Template = [var_Chart.Label(1) = ""]
endwith
// var_Chart.Label(2) = ""
with (oGantt)
TemplateDef = [dim var_Chart]
TemplateDef = var_Chart
Template = [var_Chart.Label(2) = ""]
endwith
// var_Chart.Label(17) = ""
with (oGantt)
TemplateDef = [dim var_Chart]
TemplateDef = var_Chart
Template = [var_Chart.Label(17) = ""]
endwith
// var_Chart.Label(65536) = ""
with (oGantt)
TemplateDef = [dim var_Chart]
TemplateDef = var_Chart
Template = [var_Chart.Label(65536) = ""]
endwith
// var_Chart.Label(1048576) = ""
with (oGantt)
TemplateDef = [dim var_Chart]
TemplateDef = var_Chart
Template = [var_Chart.Label(1048576) = ""]
endwith
// var_Chart.Label(16777216) = ""
with (oGantt)
TemplateDef = [dim var_Chart]
TemplateDef = var_Chart
Template = [var_Chart.Label(16777216) = ""]
endwith
var_Chart.OverviewZoomUnit = 52
oGantt.Columns.Add("")
var_Items = oGantt.Items
// var_Items.CellSingleLine(var_Items.AddItem("Right click the Overview area and select a new scale"),0) = false
with (oGantt)
TemplateDef = [dim var_Items]
TemplateDef = var_Items
Template = [var_Items.CellSingleLine(AddItem("Right click the Overview area and select a new scale"),0) = False]
endwith
|
|
451
|
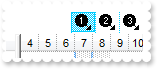
How can I add icons or pictures to the scale or zoom area
local oGantt,var_Chart
oGantt = form.EXGANTTCHARTACTIVEXCONTROL1.nativeObject
oGantt.Template = [HTMLPicture("pic1") = "c:\exontrol\images\zipdisk.gif"] // oGantt.HTMLPicture("pic1") = "c:\exontrol\images\zipdisk.gif"
oGantt.Images("gBJJgBAIDAAGAAEAAQhYAf8Pf4hh0QihCJo2AEZjQAjEZFEaIEaEEaAIAkcbk0olUrlktl0vmExmUzmk1m03nE5nU7nk9n0/oFBoVDolFo1HpFJpVLplNp1PqFRqVTqlVq1XrFZrVbrldr1fsFhsVjslls1ntFptVrtltt1vuFxuVzul1u13vF5vV7vl9v1/wGBwWDwmFw2HxGJxWLxmNx0xiFdyOTh8Tf9ZymXx+QytcyNgz8r0OblWjyWds+m0ka1Vf1ta1+r1mos2xrG2xeZ0+a0W0qOx3GO4NV3WeyvD2XJ5XL5nN51aiw+lfSj0gkUkAEllHanHI5j/cHg8EZf7w8vl8j4f/qfEZeB09/vjLAB30+kZQAP/P5/H6/yNAOAEAwCjMBwFAEDwJBMDwLBYAP2/8Hv8/gAGAD8LQs9w/nhDY/oygIA=")
var_Chart = oGantt.Chart
var_Chart.OverviewHeight = 48
var_Chart.OverviewVisible = true
var_Chart.AllowOverviewZoom = 1
var_Chart.OverviewZoomCaption = "Year|�Year|�Year|<img>3</img> Week|Third|<img>2</img> Day|<img>pic1</img>|Hour|Min|Sec"
// var_Chart.Label(0) = ""
with (oGantt)
TemplateDef = [dim var_Chart]
TemplateDef = var_Chart
Template = [var_Chart.Label(0) = ""]
endwith
// var_Chart.Label(1) = ""
with (oGantt)
TemplateDef = [dim var_Chart]
TemplateDef = var_Chart
Template = [var_Chart.Label(1) = ""]
endwith
// var_Chart.Label(2) = ""
with (oGantt)
TemplateDef = [dim var_Chart]
TemplateDef = var_Chart
Template = [var_Chart.Label(2) = ""]
endwith
// var_Chart.Label(17) = ""
with (oGantt)
TemplateDef = [dim var_Chart]
TemplateDef = var_Chart
Template = [var_Chart.Label(17) = ""]
endwith
// var_Chart.Label(65536) = ""
with (oGantt)
TemplateDef = [dim var_Chart]
TemplateDef = var_Chart
Template = [var_Chart.Label(65536) = ""]
endwith
// var_Chart.Label(1048576) = ""
with (oGantt)
TemplateDef = [dim var_Chart]
TemplateDef = var_Chart
Template = [var_Chart.Label(1048576) = ""]
endwith
// var_Chart.Label(16777216) = ""
with (oGantt)
TemplateDef = [dim var_Chart]
TemplateDef = var_Chart
Template = [var_Chart.Label(16777216) = ""]
endwith
var_Chart.OverviewZoomUnit = 52
|
|
450
|
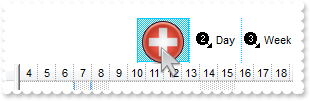
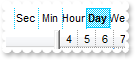
How can I change the width of the unit in the scale or zoom
local oGantt,var_Chart
oGantt = form.EXGANTTCHARTACTIVEXCONTROL1.nativeObject
oGantt.Images("gBJJgBAIDAAGAAEAAQhYAf8Pf4hh0QihCJo2AEZjQAjEZFEaIEaEEaAIAkcbk0olUrlktl0vmExmUzmk1m03nE5nU7nk9n0/oFBoVDolFo1HpFJpVLplNp1PqFRqVTqlVq1XrFZrVbrldr1fsFhsVjslls1ntFptVrtltt1vuFxuVzul1u13vF5vV7vl9v1/wGBwWDwmFw2HxGJxWLxmNx0xiFdyOTh8Tf9ZymXx+QytcyNgz8r0OblWjyWds+m0ka1Vf1ta1+r1mos2xrG2xeZ0+a0W0qOx3GO4NV3WeyvD2XJ5XL5nN51aiw+lfSj0gkUkAEllHanHI5j/cHg8EZf7w8vl8j4f/qfEZeB09/vjLAB30+kZQAP/P5/H6/yNAOAEAwCjMBwFAEDwJBMDwLBYAP2/8Hv8/gAGAD8LQs9w/nhDY/oygIA=")
var_Chart = oGantt.Chart
var_Chart.OverviewVisible = true
var_Chart.AllowOverviewZoom = 1
var_Chart.OverviewZoomCaption = "Year|�Year|�Year|<img>3</img>|Third|<img>2</img>|<img>1</img>|Hour|Min|Sec"
// var_Chart.Label(0) = ""
with (oGantt)
TemplateDef = [dim var_Chart]
TemplateDef = var_Chart
Template = [var_Chart.Label(0) = ""]
endwith
// var_Chart.Label(1) = ""
with (oGantt)
TemplateDef = [dim var_Chart]
TemplateDef = var_Chart
Template = [var_Chart.Label(1) = ""]
endwith
// var_Chart.Label(2) = ""
with (oGantt)
TemplateDef = [dim var_Chart]
TemplateDef = var_Chart
Template = [var_Chart.Label(2) = ""]
endwith
// var_Chart.Label(17) = ""
with (oGantt)
TemplateDef = [dim var_Chart]
TemplateDef = var_Chart
Template = [var_Chart.Label(17) = ""]
endwith
// var_Chart.Label(65536) = ""
with (oGantt)
TemplateDef = [dim var_Chart]
TemplateDef = var_Chart
Template = [var_Chart.Label(65536) = ""]
endwith
// var_Chart.Label(1048576) = ""
with (oGantt)
TemplateDef = [dim var_Chart]
TemplateDef = var_Chart
Template = [var_Chart.Label(1048576) = ""]
endwith
// var_Chart.Label(16777216) = ""
with (oGantt)
TemplateDef = [dim var_Chart]
TemplateDef = var_Chart
Template = [var_Chart.Label(16777216) = ""]
endwith
var_Chart.OverviewZoomUnit = 24
|
|
449
|
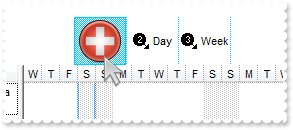
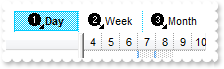
How can I a scale or zoom of the chart, when right clicking the chart's header
local oGantt,var_Chart,var_Items
oGantt = form.EXGANTTCHARTACTIVEXCONTROL1.nativeObject
oGantt.Images("gBJJgBAIDAAGAAEAAQhYAf8Pf4hh0QihCJo2AEZjQAjEZFEaIEaEEaAIAkcbk0olUrlktl0vmExmUzmk1m03nE5nU7nk9n0/oFBoVDolFo1HpFJpVLplNp1PqFRqVTqlVq1XrFZrVbrldr1fsFhsVjslls1ntFptVrtltt1vuFxuVzul1u13vF5vV7vl9v1/wGBwWDwmFw2HxGJxWLxmNx0xiFdyOTh8Tf9ZymXx+QytcyNgz8r0OblWjyWds+m0ka1Vf1ta1+r1mos2xrG2xeZ0+a0W0qOx3GO4NV3WeyvD2XJ5XL5nN51aiw+lfSj0gkUkAEllHanHI5j/cHg8EZf7w8vl8j4f/qfEZeB09/vjLAB30+kZQAP/P5/H6/yNAOAEAwCjMBwFAEDwJBMDwLBYAP2/8Hv8/gAGAD8LQs9w/nhDY/oygIA=")
var_Chart = oGantt.Chart
var_Chart.OverviewVisible = true
var_Chart.AllowOverviewZoom = -1
var_Chart.OverviewZoomCaption = "Year|�Year|�Year|<img>3</img>Month|Third|<img>2</img>Week|<img>1</img>Day|Hour|Min|Sec"
// var_Chart.Label(0) = ""
with (oGantt)
TemplateDef = [dim var_Chart]
TemplateDef = var_Chart
Template = [var_Chart.Label(0) = ""]
endwith
// var_Chart.Label(1) = ""
with (oGantt)
TemplateDef = [dim var_Chart]
TemplateDef = var_Chart
Template = [var_Chart.Label(1) = ""]
endwith
// var_Chart.Label(2) = ""
with (oGantt)
TemplateDef = [dim var_Chart]
TemplateDef = var_Chart
Template = [var_Chart.Label(2) = ""]
endwith
// var_Chart.Label(17) = ""
with (oGantt)
TemplateDef = [dim var_Chart]
TemplateDef = var_Chart
Template = [var_Chart.Label(17) = ""]
endwith
// var_Chart.Label(65536) = ""
with (oGantt)
TemplateDef = [dim var_Chart]
TemplateDef = var_Chart
Template = [var_Chart.Label(65536) = ""]
endwith
// var_Chart.Label(1048576) = ""
with (oGantt)
TemplateDef = [dim var_Chart]
TemplateDef = var_Chart
Template = [var_Chart.Label(1048576) = ""]
endwith
// var_Chart.Label(16777216) = ""
with (oGantt)
TemplateDef = [dim var_Chart]
TemplateDef = var_Chart
Template = [var_Chart.Label(16777216) = ""]
endwith
var_Chart.OverviewZoomUnit = 64
oGantt.Columns.Add("")
var_Items = oGantt.Items
// var_Items.CellSingleLine(var_Items.AddItem("Right click the Overview area and select a new scale"),0) = false
with (oGantt)
TemplateDef = [dim var_Items]
TemplateDef = var_Items
Template = [var_Items.CellSingleLine(AddItem("Right click the Overview area and select a new scale"),0) = False]
endwith
|
|
448
|
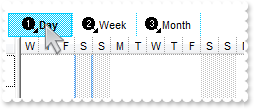
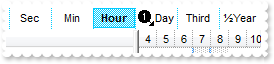
How can I a customize the scale or zoom of the chart
local oGantt,var_Chart
oGantt = form.EXGANTTCHARTACTIVEXCONTROL1.nativeObject
oGantt.Images("gBJJgBAIDAAGAAEAAQhYAf8Pf4hh0QihCJo2AEZjQAjEZFEaIEaEEaAIAkcbk0olUrlktl0vmExmUzmk1m03nE5nU7nk9n0/oFBoVDolFo1HpFJpVLplNp1PqFRqVTqlVq1XrFZrVbrldr1fsFhsVjslls1ntFptVrtltt1vuFxuVzul1u13vF5vV7vl9v1/wGBwWDwmFw2HxGJxWLxmNx0xiFdyOTh8Tf9ZymXx+QytcyNgz8r0OblWjyWds+m0ka1Vf1ta1+r1mos2xrG2xeZ0+a0W0qOx3GO4NV3WeyvD2XJ5XL5nN51aiw+lfSj0gkUkAEllHanHI5j/cHg8EZf7w8vl8j4f/qfEZeB09/vjLAB30+kZQAP/P5/H6/yNAOAEAwCjMBwFAEDwJBMDwLBYAP2/8Hv8/gAGAD8LQs9w/nhDY/oygIA=")
var_Chart = oGantt.Chart
var_Chart.OverviewVisible = true
var_Chart.AllowOverviewZoom = 1
var_Chart.OverviewZoomCaption = "Year|�Year|�Year|<img>3</img>Month|Third|<img>2</img>Week|<img>1</img>Day|Hour|Min|Sec"
// var_Chart.Label(0) = ""
with (oGantt)
TemplateDef = [dim var_Chart]
TemplateDef = var_Chart
Template = [var_Chart.Label(0) = ""]
endwith
// var_Chart.Label(1) = ""
with (oGantt)
TemplateDef = [dim var_Chart]
TemplateDef = var_Chart
Template = [var_Chart.Label(1) = ""]
endwith
// var_Chart.Label(2) = ""
with (oGantt)
TemplateDef = [dim var_Chart]
TemplateDef = var_Chart
Template = [var_Chart.Label(2) = ""]
endwith
// var_Chart.Label(17) = ""
with (oGantt)
TemplateDef = [dim var_Chart]
TemplateDef = var_Chart
Template = [var_Chart.Label(17) = ""]
endwith
// var_Chart.Label(65536) = ""
with (oGantt)
TemplateDef = [dim var_Chart]
TemplateDef = var_Chart
Template = [var_Chart.Label(65536) = ""]
endwith
// var_Chart.Label(1048576) = ""
with (oGantt)
TemplateDef = [dim var_Chart]
TemplateDef = var_Chart
Template = [var_Chart.Label(1048576) = ""]
endwith
// var_Chart.Label(16777216) = ""
with (oGantt)
TemplateDef = [dim var_Chart]
TemplateDef = var_Chart
Template = [var_Chart.Label(16777216) = ""]
endwith
var_Chart.OverviewZoomUnit = 64
|
|
447
|
How can I a scale or zoom the chart at runtime
local oGantt,var_Chart
oGantt = form.EXGANTTCHARTACTIVEXCONTROL1.nativeObject
oGantt.Images("gBJJgBAIDAAGAAEAAQhYAf8Pf4hh0QihCJo2AEZjQAjEZFEaIEaEEaAIAkcbk0olUrlktl0vmExmUzmk1m03nE5nU7nk9n0/oFBoVDolFo1HpFJpVLplNp1PqFRqVTqlVq1XrFZrVbrldr1fsFhsVjslls1ntFptVrtltt1vuFxuVzul1u13vF5vV7vl9v1/wGBwWDwmFw2HxGJxWLxmNx0xiFdyOTh8Tf9ZymXx+QytcyNgz8r0OblWjyWds+m0ka1Vf1ta1+r1mos2xrG2xeZ0+a0W0qOx3GO4NV3WeyvD2XJ5XL5nN51aiw+lfSj0gkUkAEllHanHI5j/cHg8EZf7w8vl8j4f/qfEZeB09/vjLAB30+kZQAP/P5/H6/yNAOAEAwCjMBwFAEDwJBMDwLBYAP2/8Hv8/gAGAD8LQs9w/nhDY/oygIA=")
var_Chart = oGantt.Chart
var_Chart.OverviewVisible = true
var_Chart.AllowOverviewZoom = 1
var_Chart.OverviewZoomCaption = "�Year|�Year|<img>3</img>Month|Third|<img>2</img>Week|<img>1</img>Day|Hour|Min|Sec"
|
|
446
|
How can I a scale or zoom the chart at runtime
local oGantt,var_Chart

oGantt = form.EXGANTTCHARTACTIVEXCONTROL1.nativeObject
var_Chart = oGantt.Chart
	var_Chart.OverviewVisible = true
	var_Chart.AllowOverviewZoom = 1
	var_Chart.OverviewZoomUnit = 24
|
|
445
|
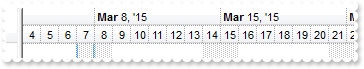
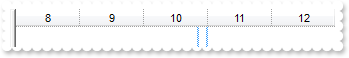
How can I a programmatically select a date
local oGantt,var_Chart,var_Chart1

oGantt = form.EXGANTTCHARTACTIVEXCONTROL1.nativeObject
oGantt.Chart.MarkSelectDateColor = 0xff
oGantt.Chart.FirstVisibleDate = "01/01/2001"
// oGantt.Chart.SelectDate("01/02/2001") = true
var_Chart = oGantt.Chart
with (oGantt)
	TemplateDef = [dim var_Chart]
	TemplateDef = var_Chart
	Template = [var_Chart.SelectDate(#1/2/2001#) = True]
endwith
// oGantt.Chart.SelectDate("01/05/2001") = true
var_Chart1 = oGantt.Chart
with (oGantt)
	TemplateDef = [dim var_Chart1]
	TemplateDef = var_Chart1
	Template = [var_Chart1.SelectDate(#1/5/2001#) = True]
endwith
oGantt.Chart.SelectLevel = 0
|
|
444
|
How can I change the color to select a date, when clicking the chart's header
local oGantt

oGantt = form.EXGANTTCHARTACTIVEXCONTROL1.nativeObject
oGantt.Chart.BackColor = 0xffffff
oGantt.Chart.MarkSelectDateColor = 0xff
|
|
443
|
How can I enable or disable selecting a date, when clicking the chart's header
local oGantt

oGantt = form.EXGANTTCHARTACTIVEXCONTROL1.nativeObject
oGantt.Chart.BackColor = 0xffffff
oGantt.Chart.MarkSelectDateColor = 0xffffff
|
|
442
|
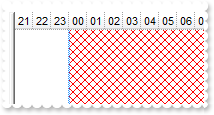
How can I specify the color or the stype for non working hours
local oGantt,var_Chart

oGantt = form.EXGANTTCHARTACTIVEXCONTROL1.nativeObject
oGantt.Chart.UnitScale = 65536
// oGantt.Chart.PaneWidth(false) = 0
var_Chart = oGantt.Chart
with (oGantt)
	TemplateDef = [dim var_Chart]
	TemplateDef = var_Chart
	Template = [var_Chart.PaneWidth(False) = 0]
endwith
oGantt.Chart.NonworkingHours = 127
oGantt.Chart.NonworkingHoursPattern = 12
oGantt.Chart.NonworkingHoursColor = 0xff
|
|
441
|
How can I specify the pattern or the stype for non working hours
local oGantt,var_Chart

oGantt = form.EXGANTTCHARTACTIVEXCONTROL1.nativeObject
oGantt.Chart.UnitScale = 65536
// oGantt.Chart.PaneWidth(false) = 0
var_Chart = oGantt.Chart
with (oGantt)
	TemplateDef = [dim var_Chart]
	TemplateDef = var_Chart
	Template = [var_Chart.PaneWidth(False) = 0]
endwith
oGantt.Chart.NonworkingHours = 127
oGantt.Chart.NonworkingHoursPattern = 7
|
|
440
|
How can I specify the non working hours
local oGantt,var_Chart

oGantt = form.EXGANTTCHARTACTIVEXCONTROL1.nativeObject
oGantt.Chart.UnitScale = 65536
// oGantt.Chart.PaneWidth(false) = 0
var_Chart = oGantt.Chart
with (oGantt)
	TemplateDef = [dim var_Chart]
	TemplateDef = var_Chart
	Template = [var_Chart.PaneWidth(False) = 0]
endwith
oGantt.Chart.NonworkingHours = 127
|
|
439
|
How can I get the index of the level from the point or cursor
local oGantt,var_LevelFromPoint

oGantt = form.EXGANTTCHARTACTIVEXCONTROL1.nativeObject
var_LevelFromPoint = oGantt.Chart.LevelFromPoint(0,0)
|
|
438
|
How can I get the link from the point or cursor
local oGantt,var_LinkFromPoint

oGantt = form.EXGANTTCHARTACTIVEXCONTROL1.nativeObject
var_LinkFromPoint = oGantt.Chart.LinkFromPoint(0,0)
|
|
437
|
How can I check or verify if a date is a non working day
local oGantt

oGantt = form.EXGANTTCHARTACTIVEXCONTROL1.nativeObject
oGantt.Chart.FirstVisibleDate = "01/01/2001"
oGantt.Columns.Add(Str(oGantt.Chart.IsNonworkingDate("01/01/2001")))
|
|
436
|
How can I check or verify if a date fits the chart's visible area
local oGantt

oGantt = form.EXGANTTCHARTACTIVEXCONTROL1.nativeObject
oGantt.Chart.FirstVisibleDate = "01/01/2001"
oGantt.Columns.Add(Str(oGantt.Chart.IsDateVisible("01/01/2001")))
|
|
435
|
How can I add a remove all non working days
local oGantt

oGantt = form.EXGANTTCHARTACTIVEXCONTROL1.nativeObject
oGantt.Chart.NonworkingDays = 0
oGantt.Chart.FirstVisibleDate = "01/01/2001"
oGantt.Chart.AddNonworkingDate("01/01/2001")
oGantt.Chart.ClearNonworkingDates()
|
|
434
|
How can I add a remove a non working days
local oGantt

oGantt = form.EXGANTTCHARTACTIVEXCONTROL1.nativeObject
oGantt.Chart.NonworkingDays = 0
oGantt.Chart.FirstVisibleDate = "01/01/2001"
oGantt.Chart.AddNonworkingDate("01/01/2001")
oGantt.Chart.RemoveNonworkingDate("01/01/2001")
|
|
433
|
How can I add a custom non working days
local oGantt

oGantt = form.EXGANTTCHARTACTIVEXCONTROL1.nativeObject
oGantt.Chart.NonworkingDays = 0
oGantt.Chart.FirstVisibleDate = "01/01/2001"
oGantt.Chart.AddNonworkingDate("01/01/2001")
oGantt.Chart.AddNonworkingDate("01/05/2001")
|
|
432
|
How can hide the non working days
local oGantt

oGantt = form.EXGANTTCHARTACTIVEXCONTROL1.nativeObject
oGantt.Chart.ShowNonworkingDates = false
|
|
431
|
How can hide the non working days
local oGantt

oGantt = form.EXGANTTCHARTACTIVEXCONTROL1.nativeObject
oGantt.Chart.NonworkingDays = 0
|
|
430
|
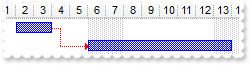
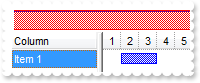
How can I change the width of the links between bars
local oGantt,var_Items

oGantt = form.EXGANTTCHARTACTIVEXCONTROL1.nativeObject
oGantt.Chart.LinksStyle = 0
oGantt.Chart.LinksWidth = 2
oGantt.Chart.FirstVisibleDate = "01/01/2001"
oGantt.Columns.Add("Column")
var_Items = oGantt.Items
	var_Items.AddBar(var_Items.AddItem("Item 1"),"Task","01/02/2001","01/04/2001","B1")
	var_Items.AddBar(var_Items.AddItem("Item 2"),"Task","01/06/2001","01/14/2001","B2")
	var_Items.AddLink("L1",var_Items.FindItem("Item 1",0),"B1",var_Items.FindItem("Item 2",0),"B2")
|
|
429
|
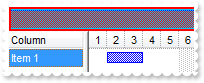
How can I change the style for the links between bars
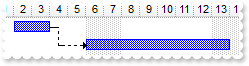
local oGantt,var_Items

oGantt = form.EXGANTTCHARTACTIVEXCONTROL1.nativeObject
oGantt.Chart.LinksStyle = 4
oGantt.Chart.FirstVisibleDate = "01/01/2001"
oGantt.Columns.Add("Column")
var_Items = oGantt.Items
	var_Items.AddBar(var_Items.AddItem("Item 1"),"Task","01/02/2001","01/04/2001","B1")
	var_Items.AddBar(var_Items.AddItem("Item 2"),"Task","01/06/2001","01/14/2001","B2")
	var_Items.AddLink("L1",var_Items.FindItem("Item 1",0),"B1",var_Items.FindItem("Item 2",0),"B2")
|
|
428
|
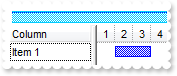
How can I change the color for the links between bars
local oGantt,var_Items

oGantt = form.EXGANTTCHARTACTIVEXCONTROL1.nativeObject
oGantt.Chart.LinksColor = 0xff
oGantt.Chart.FirstVisibleDate = "01/01/2001"
oGantt.Columns.Add("Column")
var_Items = oGantt.Items
	var_Items.AddBar(var_Items.AddItem("Item 1"),"Task","01/02/2001","01/04/2001","B1")
	var_Items.AddBar(var_Items.AddItem("Item 2"),"Task","01/06/2001","01/14/2001","B2")
	var_Items.AddLink("L1",var_Items.FindItem("Item 1",0),"B1",var_Items.FindItem("Item 2",0),"B2")
|
|
427
|
How can I hide the links between bars
local oGantt,var_Items

oGantt = form.EXGANTTCHARTACTIVEXCONTROL1.nativeObject
oGantt.Chart.FirstVisibleDate = "01/01/2001"
oGantt.Columns.Add("Column")
var_Items = oGantt.Items
	var_Items.AddBar(var_Items.AddItem("Item 1"),"Task","01/02/2001","01/04/2001","B1")
	var_Items.AddBar(var_Items.AddItem("Item 2"),"Task","01/06/2001","01/14/2001","B2")
	var_Items.AddLink("L1",var_Items.FindItem("Item 1",0),"B1",var_Items.FindItem("Item 2",0),"B2")
oGantt.Chart.ShowLinks = false
|
|
426
|
How can I display some grid line in the overview area
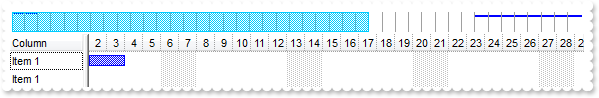
local oGantt,var_Items

oGantt = form.EXGANTTCHARTACTIVEXCONTROL1.nativeObject
oGantt.Chart.OverviewVisible = true
oGantt.Chart.OverviewLevelLines = 0
oGantt.Chart.FirstVisibleDate = "01/01/2001"
oGantt.Columns.Add("Column")
var_Items = oGantt.Items
	var_Items.AddBar(var_Items.AddItem("Item 1"),"Task","01/02/2001","01/04/2001")
	var_Items.AddBar(var_Items.AddItem("Item 1"),"Task","01/06/2001","01/14/2001")
|
|
425
|
How do I change the tooltip when the cursor hovers the overview area
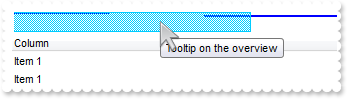
local oGantt,var_Items

oGantt = form.EXGANTTCHARTACTIVEXCONTROL1.nativeObject
oGantt.Chart.OverviewVisible = true
oGantt.Chart.OverviewToolTip = "Tooltip on the overview"
oGantt.Chart.FirstVisibleDate = "01/01/2001"
oGantt.Columns.Add("Column")
var_Items = oGantt.Items
	var_Items.AddBar(var_Items.AddItem("Item 1"),"Task","01/02/2001","01/04/2001")
	var_Items.AddBar(var_Items.AddItem("Item 1"),"Task","01/06/2001","01/14/2001")
|
|
424
|
How do I remove the tooltip when the cursor hovers the overview area
local oGantt,var_Items

oGantt = form.EXGANTTCHARTACTIVEXCONTROL1.nativeObject
oGantt.Chart.OverviewVisible = true
oGantt.Chart.OverviewToolTip = ""
oGantt.Chart.FirstVisibleDate = "01/01/2001"
oGantt.Columns.Add("Column")
var_Items = oGantt.Items
	var_Items.AddBar(var_Items.AddItem("Item 1"),"Task","01/02/2001","01/04/2001")
|
|
423
|
How do I change the selection color in the overview area
local oGantt,var_Items

oGantt = form.EXGANTTCHARTACTIVEXCONTROL1.nativeObject
oGantt.Chart.OverviewVisible = true
oGantt.Chart.OverviewSelBackColor = 0xff
oGantt.Chart.FirstVisibleDate = "01/01/2001"
oGantt.Columns.Add("Column")
var_Items = oGantt.Items
	var_Items.AddBar(var_Items.AddItem("Item 1"),"Task","01/02/2001","01/04/2001")
|
|
422
|
How do I change the background color for the overview area
local oGantt,var_Items

oGantt = form.EXGANTTCHARTACTIVEXCONTROL1.nativeObject
oGantt.Chart.OverviewVisible = true
oGantt.Chart.OverviewBackColor = 0xff
oGantt.Chart.FirstVisibleDate = "01/01/2001"
oGantt.Columns.Add("Column")
var_Items = oGantt.Items
	var_Items.AddBar(var_Items.AddItem("Item 1"),"Task","01/02/2001","01/04/2001")
|
|
421
|
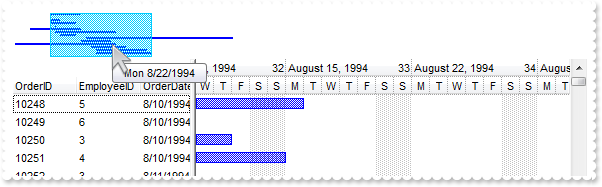
How do I specify the height for the overview area
local oGantt,var_Items

oGantt = form.EXGANTTCHARTACTIVEXCONTROL1.nativeObject
oGantt.Chart.OverviewVisible = true
oGantt.Chart.OverviewHeight = 16
oGantt.Chart.FirstVisibleDate = "01/01/2001"
oGantt.Columns.Add("Column")
var_Items = oGantt.Items
	var_Items.AddBar(var_Items.AddItem("Item 1"),"Task","01/02/2001","01/04/2001")
|
|
420
|
How do I show or hide the control's overview area
local oGantt,var_Items

oGantt = form.EXGANTTCHARTACTIVEXCONTROL1.nativeObject
oGantt.Chart.OverviewVisible = true
oGantt.Chart.FirstVisibleDate = "01/01/2001"
oGantt.Columns.Add("Column")
var_Items = oGantt.Items
	var_Items.AddBar(var_Items.AddItem("Item 1"),"Task","01/02/2001","01/04/2001")
|
|
419
|
How do I get the bar from the point or cursor
local oGantt,var_BarFromPoint

oGantt = form.EXGANTTCHARTACTIVEXCONTROL1.nativeObject
var_BarFromPoint = oGantt.Chart.BarFromPoint(0,0)
|
|
418
|
How do I specify the color of pattern for non working days
local oGantt

oGantt = form.EXGANTTCHARTACTIVEXCONTROL1.nativeObject
oGantt.Chart.NonworkingDays = 66
oGantt.Chart.NonworkingDaysPattern = 8
oGantt.Chart.NonworkingDaysColor = 0xff
|
|
417
|
How do I specify the type of pattern for non working days
local oGantt

oGantt = form.EXGANTTCHARTACTIVEXCONTROL1.nativeObject
oGantt.Chart.NonworkingDays = 66
oGantt.Chart.NonworkingDaysPattern = 11
|
|
416
|
How do I specify the non working days
local oGantt

oGantt = form.EXGANTTCHARTACTIVEXCONTROL1.nativeObject
oGantt.Chart.NonworkingDays = 66
|
|
415
|
How do I specify the non working days
local oGantt

oGantt = form.EXGANTTCHARTACTIVEXCONTROL1.nativeObject
oGantt.Chart.NonworkingDays = 66
|
|
414
|
How do I add a predefined bar
local oGantt,var_Bar,var_Items

oGantt = form.EXGANTTCHARTACTIVEXCONTROL1.nativeObject
// oGantt.Chart.Bars.Add("CustomBar").Color = 0xff
var_Bar = oGantt.Chart.Bars.Add("CustomBar")
with (oGantt)
	TemplateDef = [dim var_Bar]
	TemplateDef = var_Bar
	Template = [var_Bar.Color = 255]
endwith
oGantt.Chart.FirstVisibleDate = "01/01/2001"
oGantt.Columns.Add("Column")
var_Items = oGantt.Items
	var_Items.AddBar(var_Items.AddItem("Item 1"),"CustomBar","01/02/2001","01/04/2001")
|
|
413
|
How do I change the unit being displayed in the chart
local oGantt,var_Chart

oGantt = form.EXGANTTCHARTACTIVEXCONTROL1.nativeObject
// oGantt.Chart.PaneWidth(false) = 0
var_Chart = oGantt.Chart
with (oGantt)
	TemplateDef = [dim var_Chart]
	TemplateDef = var_Chart
	Template = [var_Chart.PaneWidth(False) = 0]
endwith
oGantt.Chart.UnitScale = 256
oGantt.Chart.UnitWidth = 64
|
|
412
|
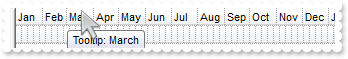
How do I specify the prodefined tooltip being shown on the chart's header, when Zoom method is used
local oGantt,var_Chart,var_Chart1,var_Chart2,var_Chart3,var_Chart4
oGantt = form.EXGANTTCHARTACTIVEXCONTROL1.nativeObject
// oGantt.Chart.PaneWidth(false) = 0
var_Chart = oGantt.Chart
with (oGantt)
TemplateDef = [dim var_Chart]
TemplateDef = var_Chart
Template = [var_Chart.PaneWidth(False) = 0]
endwith
oGantt.Chart.LevelCount = 2
// oGantt.Chart.Label(1) = ""
var_Chart1 = oGantt.Chart
with (oGantt)
TemplateDef = [dim var_Chart1]
TemplateDef = var_Chart1
Template = [var_Chart1.Label(1) = ""]
endwith
// oGantt.Chart.Label(2) = ""
var_Chart2 = oGantt.Chart
with (oGantt)
TemplateDef = [dim var_Chart2]
TemplateDef = var_Chart2
Template = [var_Chart2.Label(2) = ""]
endwith
// oGantt.Chart.Label(16) = "<%m3%>"
var_Chart3 = oGantt.Chart
with (oGantt)
TemplateDef = [dim var_Chart3]
TemplateDef = var_Chart3
Template = [var_Chart3.Label(16) = "<%m3%>"]
endwith
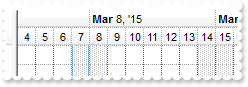
// oGantt.Chart.LabelToolTip(16) = "Tooltip: <%mmmm%>"
var_Chart4 = oGantt.Chart
with (oGantt)
TemplateDef = [dim var_Chart4]
TemplateDef = var_Chart4
Template = [var_Chart4.LabelToolTip(16) = "Tooltip: <%mmmm%>"]
endwith
oGantt.Chart.Zoom("01/01/2007","01/01/2008")
oGantt.Chart.FirstVisibleDate = "01/01/2007"
|
|
411
|
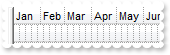
How do I specify the prodefined labels being displayed on the chart, when Zoom method is used
local oGantt,var_Chart,var_Chart1,var_Chart2,var_Chart3

oGantt = form.EXGANTTCHARTACTIVEXCONTROL1.nativeObject
// oGantt.Chart.PaneWidth(false) = 0
var_Chart = oGantt.Chart
with (oGantt)
	TemplateDef = [dim var_Chart]
	TemplateDef = var_Chart
	Template = [var_Chart.PaneWidth(False) = 0]
endwith
oGantt.Chart.LevelCount = 2
// oGantt.Chart.Label(1) = ""
var_Chart1 = oGantt.Chart
with (oGantt)
	TemplateDef = [dim var_Chart1]
	TemplateDef = var_Chart1
	Template = [var_Chart1.Label(1) = ""]
endwith
// oGantt.Chart.Label(2) = ""
var_Chart2 = oGantt.Chart
with (oGantt)
	TemplateDef = [dim var_Chart2]
	TemplateDef = var_Chart2
	Template = [var_Chart2.Label(2) = ""]
endwith
// oGantt.Chart.Label(16) = "<%m3%>"
var_Chart3 = oGantt.Chart
with (oGantt)
	TemplateDef = [dim var_Chart3]
	TemplateDef = var_Chart3
	Template = [var_Chart3.Label(16) = "<%m3%>"]
endwith
oGantt.Chart.Zoom("01/01/2007","01/01/2008")
oGantt.Chart.FirstVisibleDate = "01/01/2007"
|
|
410
|
How do I scale or zoom the chart to a specified range of date
local oGantt,var_Chart,var_Chart1,var_Chart2,var_Chart3

oGantt = form.EXGANTTCHARTACTIVEXCONTROL1.nativeObject
// oGantt.Chart.PaneWidth(false) = 0
var_Chart = oGantt.Chart
with (oGantt)
	TemplateDef = [dim var_Chart]
	TemplateDef = var_Chart
	Template = [var_Chart.PaneWidth(False) = 0]
endwith
oGantt.Chart.LevelCount = 2
// oGantt.Chart.Label(1) = ""
var_Chart1 = oGantt.Chart
with (oGantt)
	TemplateDef = [dim var_Chart1]
	TemplateDef = var_Chart1
	Template = [var_Chart1.Label(1) = ""]
endwith
// oGantt.Chart.Label(2) = ""
var_Chart2 = oGantt.Chart
with (oGantt)
	TemplateDef = [dim var_Chart2]
	TemplateDef = var_Chart2
	Template = [var_Chart2.Label(2) = ""]
endwith
// oGantt.Chart.Label(16) = "<%m3%>"
var_Chart3 = oGantt.Chart
with (oGantt)
	TemplateDef = [dim var_Chart3]
	TemplateDef = var_Chart3
	Template = [var_Chart3.Label(16) = "<%m3%>"]
endwith
oGantt.Chart.Zoom("01/01/2007","01/01/2008")
oGantt.Chart.FirstVisibleDate = "01/01/2007"
|
|
409
|
How do I scale or zoom the chart to a specified range of date
local oGantt,var_Chart

oGantt = form.EXGANTTCHARTACTIVEXCONTROL1.nativeObject
// oGantt.Chart.PaneWidth(false) = 0
var_Chart = oGantt.Chart
with (oGantt)
	TemplateDef = [dim var_Chart]
	TemplateDef = var_Chart
	Template = [var_Chart.PaneWidth(False) = 0]
endwith
oGantt.Chart.LevelCount = 2
oGantt.Chart.Zoom("01/01/2007","07/01/2007")
oGantt.Chart.FirstVisibleDate = "01/01/2007"
|
|
408
|
How do I find the next date or previous date
local oGantt,var_Chart

oGantt = form.EXGANTTCHARTACTIVEXCONTROL1.nativeObject
var_Chart = oGantt.Chart
	var_Chart.FirstVisibleDate = var_Chart.NextDate("01/01/2002",4096,1)
|
|
407
|
How can I change the color for the grid lines in the chart
local oGantt,var_Level

oGantt = form.EXGANTTCHARTACTIVEXCONTROL1.nativeObject
oGantt.Chart.DrawGridLines = -1
oGantt.Chart.LevelCount = 2
var_Level = oGantt.Chart.Level(1)
	var_Level.DrawGridLines = true
	var_Level.GridLineColor = 0xff
|
|
406
|
How can I draw, show or hide the grid lines in the chart
local oGantt,var_Level

oGantt = form.EXGANTTCHARTACTIVEXCONTROL1.nativeObject
oGantt.Chart.DrawGridLines = -1
oGantt.Chart.LevelCount = 2
// oGantt.Chart.Level(1).DrawGridLines = true
var_Level = oGantt.Chart.Level(1)
with (oGantt)
	TemplateDef = [dim var_Level]
	TemplateDef = var_Level
	Template = [var_Level.DrawGridLines = True]
endwith
|
|
405
|
How do I change the color to highlight the today in the chart
local oGantt

oGantt = form.EXGANTTCHARTACTIVEXCONTROL1.nativeObject
oGantt.Chart.MarkTodayColor = 0xff
|
|
404
|
How do I hide or stop highlighting the today area in the chart
local oGantt

oGantt = form.EXGANTTCHARTACTIVEXCONTROL1.nativeObject
oGantt.Chart.BackColor = 0xffffff
oGantt.Chart.MarkTodayColor = 0xffffff
|
|
403
|
Is there any function to get the date in the format that I use for levels, to layout my chart's header
local h,oGantt

oGantt = form.EXGANTTCHARTACTIVEXCONTROL1.nativeObject
h = oGantt.Chart.FormatDate("01/01/2002","<%yyyy%> <%mmmm%> <%d%> <%dddd%>")
oGantt.Columns.Add(Str(h))
|
|
402
|
How can I get the date from the point, cursor
/*
with (this.EXGANTTCHARTACTIVEXCONTROL1.nativeObject)
	MouseMove = class::nativeObject_MouseMove
endwith
*/
// Occurs when the user moves the mouse.
function nativeObject_MouseMove(Button, Shift, X, Y)
	oGantt = form.EXGANTTCHARTACTIVEXCONTROL1.nativeObject
	? Str(oGantt.Chart.DateFromPoint(-1,-1))
return

local oGantt

oGantt = form.EXGANTTCHARTACTIVEXCONTROL1.nativeObject
|
|
401
|
How can I show or hide the small ticker that shows up when the cursor hovers the chart area
local oGantt

oGantt = form.EXGANTTCHARTACTIVEXCONTROL1.nativeObject
oGantt.Chart.DrawDateTicker = false
|